Normetrics is an interface to research and consulting work based on econometric modelling, in particular to the development and use of the Norwegian Aggregate Model (NAM).
Link to the model documentation (pdf).
And a link to an AI-generated NAM podcast . Thanks to Jakob M. Hope for producing it !
U.S. wage-price dynamics, before, during and after COVID-19, through the lens of an
empirical econometric model
We specify a multiple-equation model with equilibrium-correction terms which connect inflation to the wage share and the functional income distribution, while not excluding a priori variables that are typically found in existing empirical U.S. Phillips curve models. We estimate the model equations using automatic variable selection with low Type-1 error probabilities on a sample with quarterly data that starts in the 1960s. Conditional on a relatively small number of location shift indicators, the price and wage equations have relatively constant parameters. The model’s explanatory power is shown by dynamic simulations. Applied to the COVID-19 period, the model shows that wage growth was important initially but that other factors later also became important, in particular the broad increase in international prices. Out of sample simulation shows how well the model forecasts inflation since early 2023.
Written by Gunnar Bårdsen and Ragnar Nymoen. Published in Oxford Bulletin of Economics and Statistics.
Link to working paper version.
Link to readable full text version of the article in OBES
Pattern wage bargaining and exchange rate
volatility in Norway
The Norwegian nominal exchange rate exhibits the typical characteristics of floating exchange rates—namely, a dominant random walk component and excessive volatility. At the same time, pattern wage bargaining creates a direct channel from the exchange rate to domestic wages, raising concerns about its compatibility with inflation targeting and the potential for a wage-exchange rate spiral.
This paper presents a model in which pattern bargaining and inflation targeting coexist without creating `over-determination’ in wage and price setting. Using a combination of analytical results and numerical simulations, the study demonstrates that wage and price dynamics remain stable under reasonable parameter assumptions—even when allowing for two-way causality between inflation and depreciation. Moreover, the comparative dynamics of the theoretical model align with those of an empirical model of the Norwegian economy.
The findings help explain why, after 25 years of inflation targeting, pattern bargaining persists despite repeated predictions of its demise. The forecasting environment for wage setters under a floating exchange rate remained fundamentally unchanged: institutionalized cost-of-living forecasts continued to rely on a given exchange rate. Earlier critiques arguing that wage-setting institutions had to adapt to inflation targeting were based on models that failed to capture the core dynamics of pattern bargaining, weakening their practical relevance.
Link to paper titled: Pattern wage bargaining and exchange rate
volatility in Norway
Dynamic time series modelling and forecasting of COVID-19 in Norway
A framework for forecasting new COVID-19 cases jointly with hospital admissions and hospital beds with COVID-19 cases is presented. This project, dubbed CovidMod, produced 21 days ahead forecasts each working day from March 2021 to April 2022. Comparison of RMSFEs from that period, with the RMSFEs of the Norwegian Institute of Public Health (NIPH), favours the CovidMod forecasts, both for new cases and for hospital beds. Another comparison, with the short term forecasts produced by the Cardt method, shows little difference. Next, we present a new model where smooth transition regression is used as a feasible method to include forecasted effects of non-linear policy responses to the deviation between hospital beds and hospital bed capacity, on the forecasts of the original three variables. The forecasting performance of the model with endogenous policy effects is demonstrated retrospectively. It is suggested as a complementary approach to follow when the forecasted variables are generated from processes that include policy responses as realistic features
Written by Gunnar Bårdsen and Ragnar Nymoen. Published in International Journal of Forecasting, May 2024
Economic Covid-19 effects analysed by macro econometric models—the case of Norway
Counterfactual analysis of the impact of Covid-19 can be based on a solution of a macroeconomic model for a scenario without the coronavirus interfering with the macroeconomic system. Two measures of impact are introduced with the aid of a simple theoretical model, and then used in the empirical analysis: (Ⅰ) The difference between the counterfactual without Covid-19 and a baseline model solution. (Ⅱ) The difference between the counterfactual and the actual development of the economy. In order to analyze the impact on GDP we use two model categories. First, empirical final form model equations, which were purpose-built with the aid of a machine learning algorithm. Second, an operational multiple-equation model of the Norwegian macroeconomic system. Empirically, we find a significant impact of Covid-19 on the GDP Mainland Norway in 2020. For some of the estimator/model combinations, the impacts are also significant in the two first quarters of 2021. Using the multiple-equation model, the assessment is extended to the impact of Covid-19 on value added in four Mainland Norway industries, on imports and exports, and on final consumption expenditure and gross capital formation.
Link to article in National Accounting Review (Open Access)
5 February 2023
On the Low Degree of Entropy Implied by the Solutions of Modern Macroeconomic Models
The non-causal (“forward-looking”) solution used routinely in academic macroeconomics may represent a violation of a law of entropy, namely that the direction of time is one way (from the past and towards the present), and that the variance of economic processes increases with time. In order to re-establish a degree of compatibility with the law of entropy, so called hybrid forms are required add-ins to DSGE (Dynamic Stochastic General Equilibrium) models. However, the solution that uses hybrid forms is a particular special case of a causal solutions of autoregressive distributed lags, VARs and recursive and simultaneous equations models well known from empirical macro econometrics. Hence, hybrid forms of small scale DSGE models can be analysed and tested against competing model equations, using an econometric encompassing framework.
Link to pdf of article in Entropy (Open Access).
30 Nov 2022
Wage inequality and union membership
In a new article in Oxford Economic Papers, by Elin Svartstad and Ragnar Nymoen, the empirical relationship between the within-establishment union membership rate and wage inequality in Norway is studied. The data set is a panel of 2,285 private-sector establishments observed in the period 2000–18.
Posted 13 May 2022
Covid-19 in Norway. Forecasts and actuals for Nov 2021- Feb 2022
Posted 14 Feb 2022
On the role of wage formation in macroeconometric models
Oxford Research Encyclopedia of Economics and Finance. Oxford University Press in November 2021. Link to published article.
The specification of model equations for nominal wage setting has important implications for the properties of macroeconometric models and requires system thinking and multiple equation modeling. The main models classes are the Phillips curve model (PCM), the wage–price equilibrium correction model (WP-ECM), and the New Keynesian Phillips curve (NKPCM). The PCM was included in the macroeconometric models of the 1960s. The WP‑ECM arrived in the late 1980s. The NKPCM is central in dynamic stochastic general equilibrium models (DSGEs). The three model classes can be interpreted as different specifications of the system of stochastic difference equations that define the supply side of a medium-term macroeconometric model. This calls for an appraisal of the different wage models, in particular in relation to the concept of the non-accelerating inflation rate of unemployment (NAIRU, or natural rate of unemployment), and of the methods and research strategies used. The construction of macroeconomic models used to be based on the combination of theoretical and practical skills in economic modeling. Wage formation was viewed as being forged between the forces of markets and national institutions. In the age of DSGE models, macroeconomics has become more of a theoretical discipline. Nevertheless, producers of DSGE models make use of hybrid forms if an initial theoretical specification fails to meet a benchmark for acceptable data fit. A common ground therefore exists between the NKPC, WP‑ECM, and PCM, and it is feasible to compare the model types empirically.
Link to pre-publication version of the paper.
Posted 29 November 2021
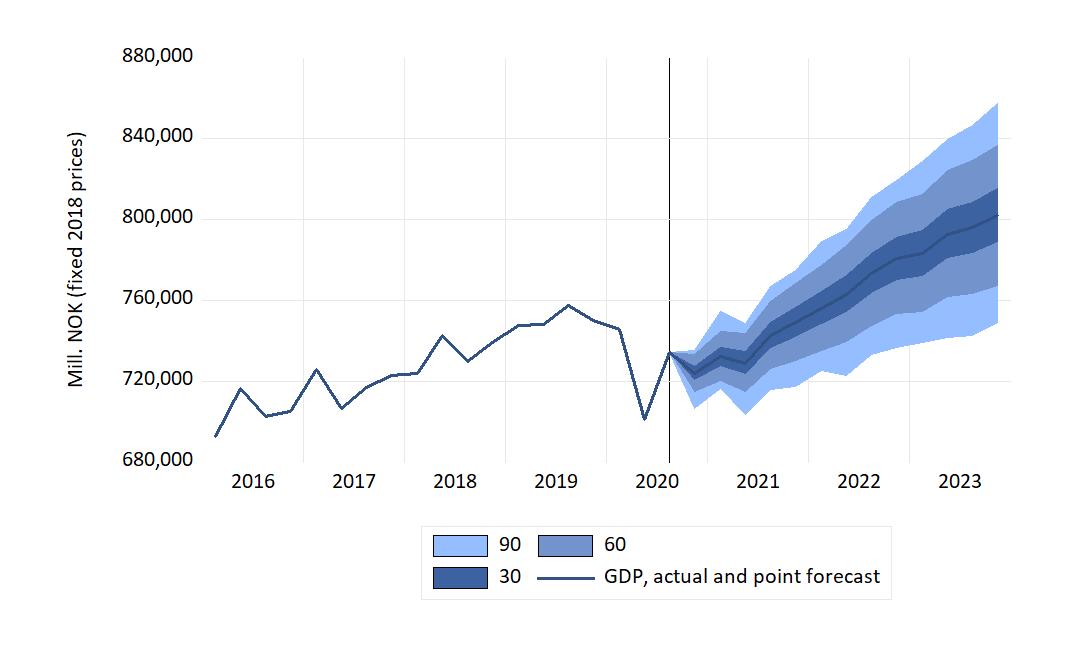
Norwegian GDP recovery after the Covid pandemic
Figure 1 shows updated NAM projections for Mainland Norway GDP (i.e., without extraction and transport of oil and of natural gas). The forecast period is 2021q2-2023q4. The time series has been seasonally adjusted. The fan-chart format is used to illustrate forecast uncertainty.
According to the point forecast (central tendency), mainland-Norway GDP will be back at the pre-pandemic level in 2021q4. This is the the same forecast as in the 9 December 2020 posting on this page (see also the Covid 19 page) .
However, the forecast fans are wide, with a notable tendency of larger downside risk, than of upside risk.
Posted 18 May 2020.
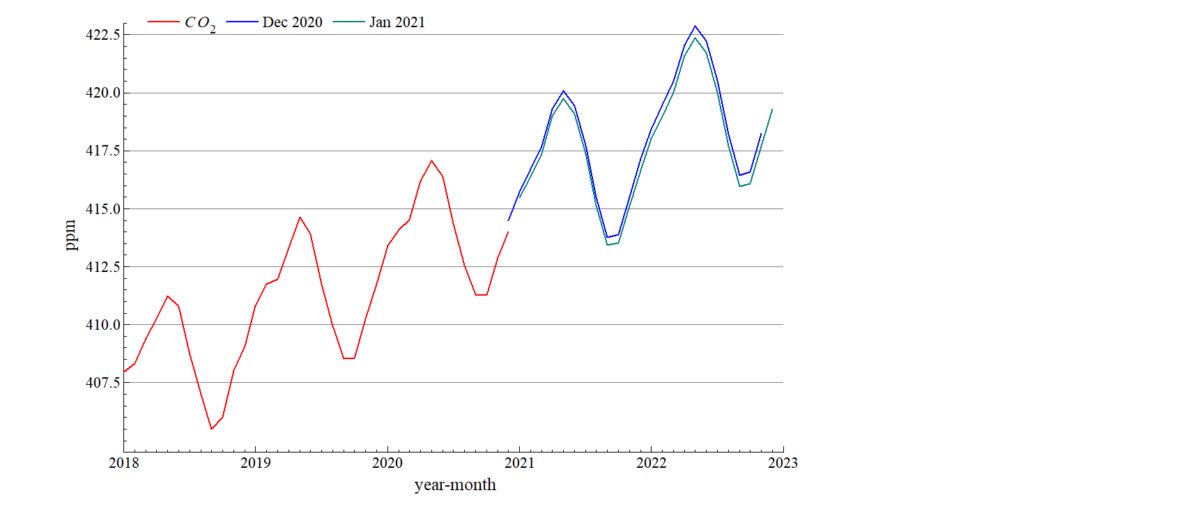
CO2 seasonality and trend.
The CO2 growth season is now well under way. Although the seasonal variation dominates, the increase in CO2 level, is clearly seen in the 24 months forecasts shown as Dec 2020 and Jan 2021 in the figure, with new all-time peaks forecasted in both 2021 and 2021.
Posted 21 January 2021.
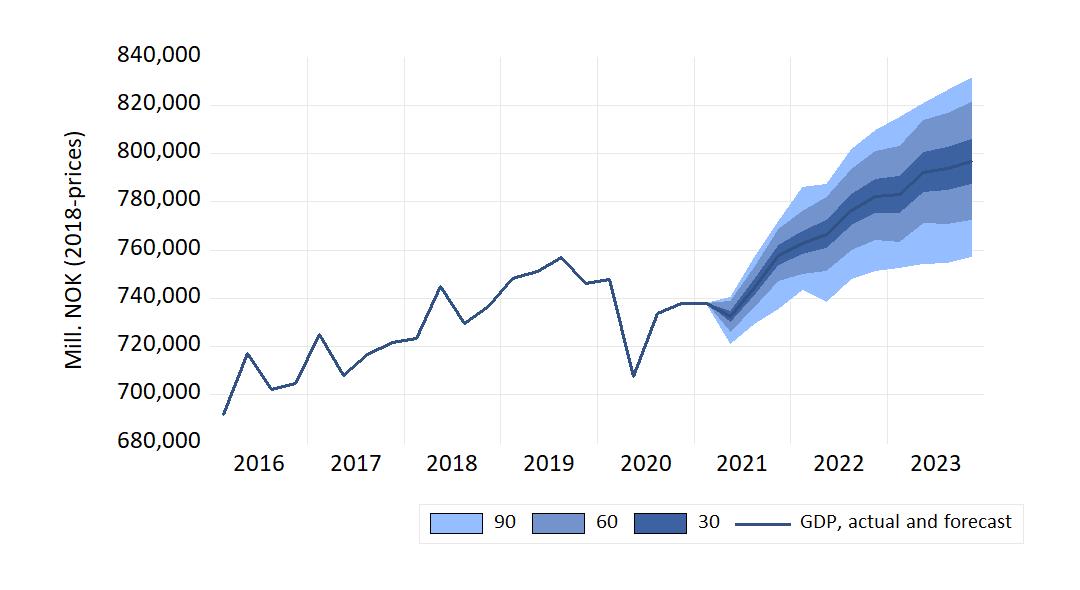
GDP recovery after the Covid pandemic: the case of Norway
When will the economy be back at the pre-Covid level of income generation? Forecasting institutions around the world now attempted to answer that question, as we begin to see the end of the pandemic.
In its Monetary Policy Report (MPR) from November, Bank of England presented projections showing that GDP in the UK could be at the level of 2019(4) two years later, in 2021(4). However, there is considerable uncertainty as the Bank’s fan-charts for GDP shows.
Figure 1 shows one projection of Mainland Norway GDP (i.e., without extraction and transport of oil and of natural gas). In the figure, the line graph to the left of the vertical line shows the actual time series for quarterly GDP (in mill. NOK, fixed prices). To the right of the vertical line, the graph represents the central projection of the macro econometric model NAM.

The interpretation of the dark (central) band is that if we imagine 100 observations of GDP over the forecast period, the actual GDP would lie within the darkest band on only 30 of those occasions. The bands labelled “60” and “90” have similar interpretations.
The figure’s central tendency therefore indicates that GDP can be expected to be back at the pre-pandemic high level in 2021q4. The central projection shows that the GDP level of 2019q4 might be reached somewhat earlier in 2021. The projected length of the recovery period is in line with Bank of England’s forecast for the UK economy mentioned above.
The economy have started on the path to recovery. As vaccine start to be rolled-out, hopes are the climb can be steeper than in the central projection. But it may yet be broken by set-backs, and not be a smooth glide path.
Posted 9 December 2020. A longer text in on the Covid 19 page
Housing prices during the pandemic
In several countries, commentators have expressed surprise about the resilience of housing markets so far during the pandemic. Norway is no exception. The implosion scenario, which was a possibility at the start of the pandemic, did not occur. Instead, the nominal house price has increased at the national level.
One perspective on this issue can be obtained by simulating NAM, an empirical macro econometric model of the Norwegian economy. The figure shows the actual price development from 2016q1 to 2020q3, together with the simulated housing price index for 2020q1-2020q4. The fan represents 90 % confidence intervals for the simulated values.
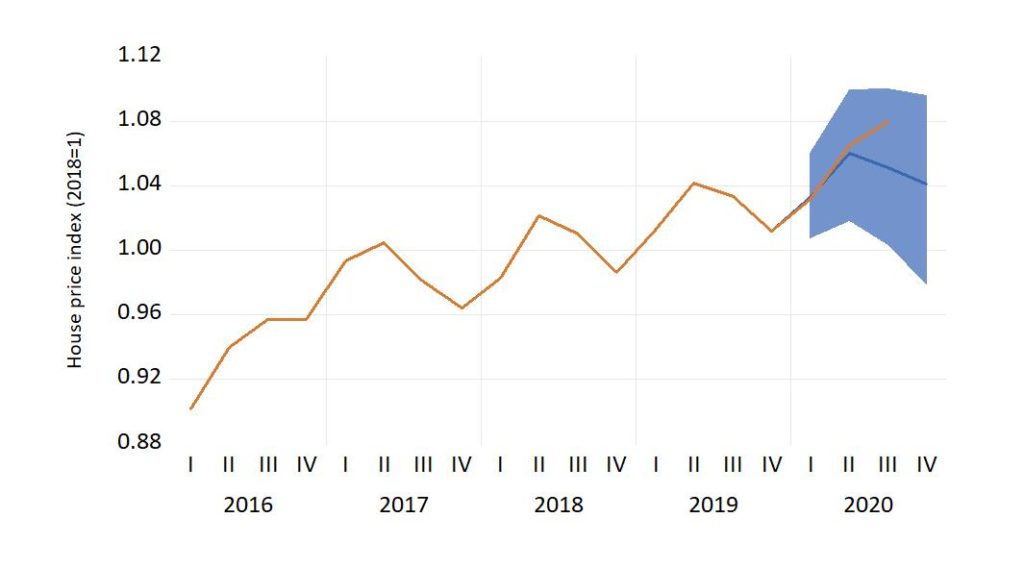
The figure confirms that the performance of the housing price has been strong, but not surprisingly strong, so far in the pandemic. However, there is a potential for bigger surprises. In the short-term maybe in the form of higher prices. In the medium term perspective, the signs are more difficult to read. Rising household debt, from a high level, is still the thin end of the wedge.
Link to a note written in Norwegian
Posted 26 Nov 2020
CO2 update: November 2019-20
The figure shows graphs of the forecasts from November 2019 (conditional on October 2019 data) together with actuals and the current forecast, from November 2020. We see that the there is little surprise in the development: The actuals were rather accurately forecasted by the projections from a year ago, and there is good agreement between the two forecasts, where they overlap.
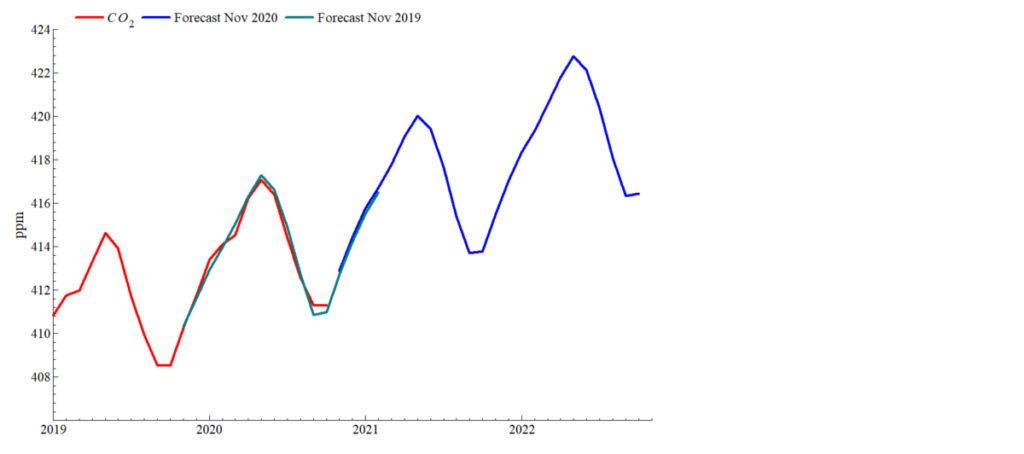
The CO2 forecast page contains more details and data. Posted 16 Nov 2020.
CO2 in the athmosphere: As low as it gets…
The annual cycle of CO2 in the atmosphere over Mauna Loa is nearing its trough for 2020. The updated forecast shows that there is a 50-50 for the level to have increased already in October. The new peak is forecasted to occur in May 2021. The forecast uncertainty band for May 2021 shows that a peak only moderately higher than this year will be a big surprise.
The CO2 forecast page contains more details and data. Posted 22 Oct 2020.
Sudden changes in economic activity, with and without lock-down
This comment, in the Norwegian journal Samfunnsøkonomen, discusses how a particular form of imbalance in capital markets (related to overdermination of the interest rate) can harbour quick and unexpected changes in macro economic actvity, with and without lock-down.
Mulighetene for brå endring i den økonomiske aktivitet, med og uten
«lock-down»
See also the Covid-19 page
Posted 15 September 2020
Full circle: One year of CO2 forecasts
The September 2020 forecasts of atmospheric CO2 at Mauna Loa marks one full year of monthly forecasts posted on Normetrics.no. The figure shows the actual CO2 level (green line graph) together with the new September 2020 forecast (blue) and the forecast form September 2019 (red).
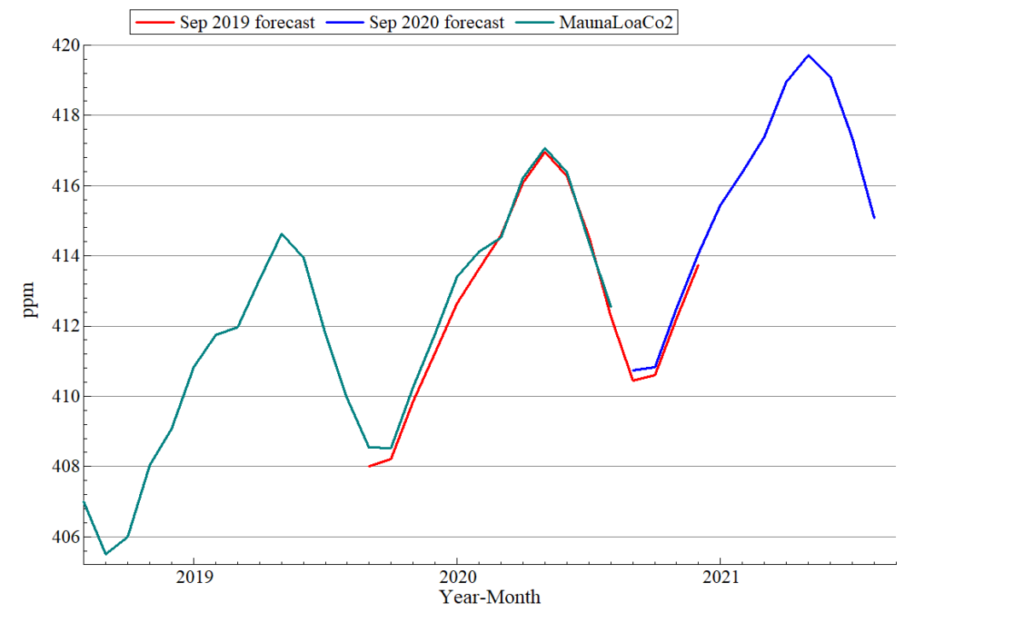
The September 2020 forecast underestimated the steepness of the Co2 during the autumn of 2019 somewhat. The peak in the April-June2020 was accurately forecasted though.
The difference between the two September forecasts is that 2020 is conditional on the CO2 level in August 2020, while the first forecast was conditional on August 2019. Although it is not large, the still visible difference between the two line graphs for September-December 2020, indicate that the difference in initial conditions had an impact on the forecasts.
The CO2 forecast page contains more details and data.
Posted 15 September 2020
New research articles on the modelling of pattern wage bagaining
Wage coordination plays an important role in macroeconomic stabilization. Pattern wage bargaining systems have been common in Europe, but in different forms, and with different degrees of success in terms of actual coordination reached. A recently published paper written by Marit Gjelsvik, Ragnar Nymoen and Victoria Sparrman focuses on wage formation in Norway, a small open economy, where it is custom to regard the manufacturing industry as the wage leader. The authors estimate a model of wage formation in manufacturing and in two other sectors. Deciding cointegration rank is an important step in the analysis, economically as well statistically. In combination with simultaneous equation modelling, the cointegration analysis provides evidence that collective wage negotiations in manufacturing have defined wage norms for the rest of the economy over the period 1980(1)–2014(4).
The paper is titled “Cointegration and Structure in Norwegian Wage–Price Dynamics” and is published in Econometrics 2020, 8(3), 29; https://doi.org/10.3390/econometrics8030029
The article belongs to the Special Issue Celebrated Econometricians: Katarina Juselius and Søren Johansen
Earlier this year, Simon Dalnoki published a research paper in the Norwegian Journal Samfunnsøkonomen: Empirisk modellering av systemet for norsk lønndannelse.
Posted 14 August 2020
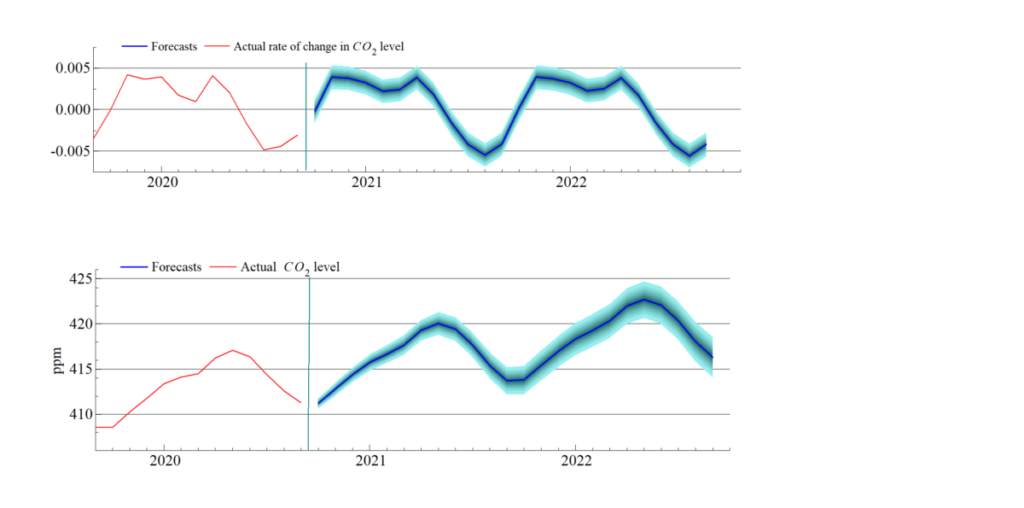
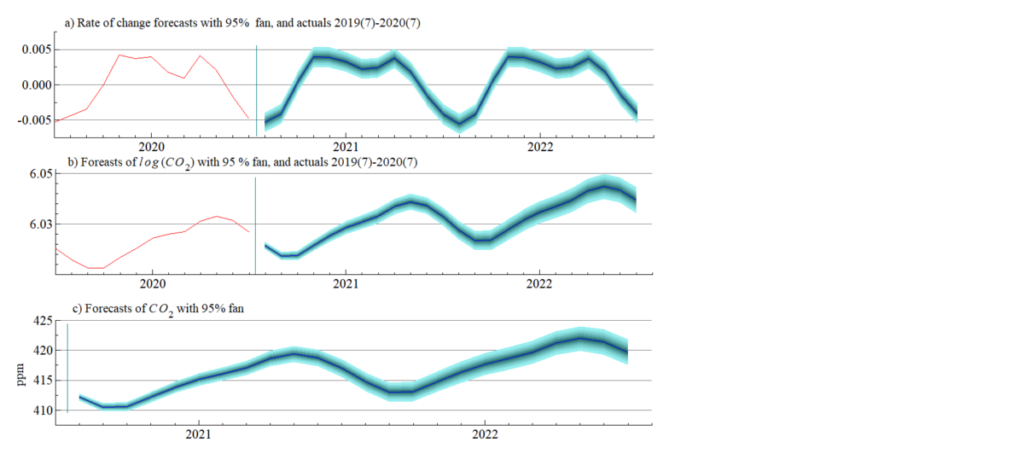
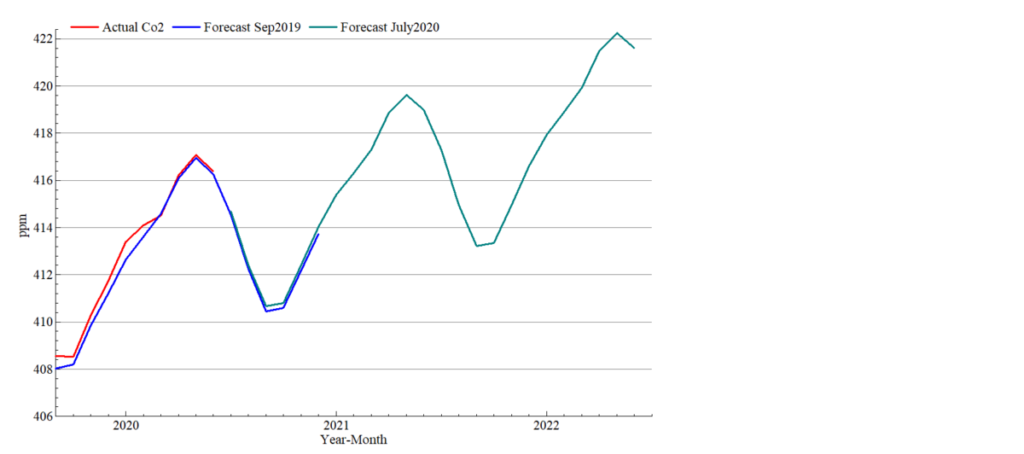
Atmospheric CO2 forecast update: A small reduction in the growth rate
The monthly average of atmospheric CO2 for July was 414.4 ppm which was a lower than the forecast conditional on June information, but not significantly lower.
The figure shows updated forecasts, conditional on data that includes July 2020. Panel a) in the figure shows the monthly rate of change. Interestingly, the point forecast for August (the middle of the fan) can be gauged to be a little lower than the rate of change one year earlier. However, since the level of CO2 has risen over the last year, the forecasted level (in log scale in panel b)) is higher for August 2020 than it was in August 2019.
The level of CO2 in the measured units of ppm is forecasts to continue its secular increase. The previous peak (417.07 ppm) form May 2020 is forecasted to be overtaken during the spring of 2021 with a new peak in May 2021 (418 ppm) and the next one in May 2022 (422 ppm).
The CO2 forecast page contains more details and data.
Posted 11 August 2020.
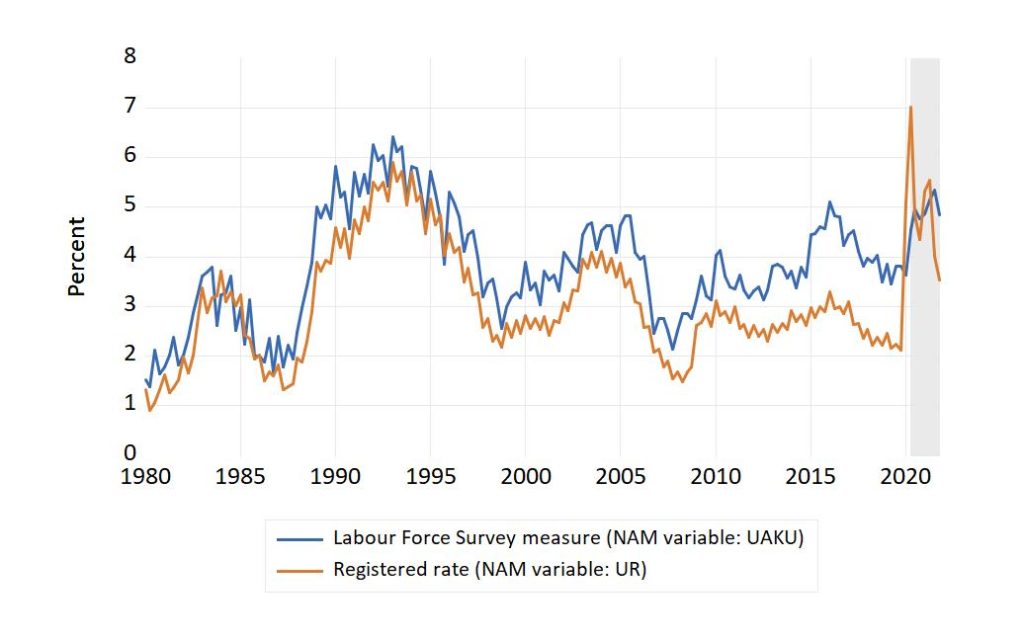
Labour market changes
New unemployment data from Statistics Norway (23 July 2020) showed that in the second quarter of 2020 the unemployment rate had increased to 4.6 per cent, up 1.2 percentage points from the seconf quarter of 2019. These numbers are from the labour force survey, which needs to be kept apart from the numbers for registered unemployment compiled by NAV.
As the figure shows, the usual pattern has been that the labour force measure of the unemployment rate is higher than the registered rate (and the gap has been consistently wider after 2010 than before). But this changed in the first quarter of 2020, when the registered rate rose to 5.1 percent while the Labour force survey measure was almost unchanged at 3.6 percent.
See the Covid-19 page for more. Posted 28 July 2020.
Mauna Loa CO2 forecast update: Seasonal reduction
After the historical peak in May 2020, the atmospheric CO2 level became reduced in June. However, this represents a predictable seasonal reduction, as the figure illustrates.
Posted 18 July 2020
NAM and institutional forecasts for the Norwegian economy-summer 2020
In June, the two leading forecasting institutions, Statistics Norway (SSB) and Norges Bank (NB) published new forecasts for the macro economy. Both institutions expect 2021 Mainland Norway GDP to be a little above the 2019 level in 2021. The number of person employed is also expected to get back to positive growth in 2021.
As the note on mid-year forecasts shows, a main difference between the two institutional forecasts and the NAM based forecast (for 2020Q2-2023q4) is that the NAM forecast for employment in 2021 is bleaker than in the two institutional forecasts.
Posted on 10 July 2020
A predictable new world record: May 2020 CO2 level at Mauna Loa
A noted in last month’s update of the Mauna Loa CO2 forecast, the record level for April 2020 became overtaken by May. Moreover, as noted, this peak was predictable on the basis of August 2019 information (the graph labelled September 2019 in the figure).
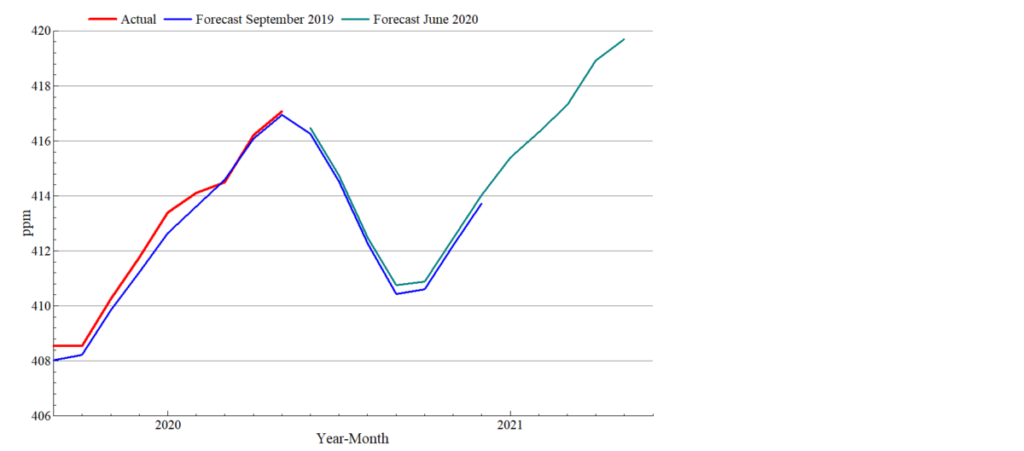
The latest forecast, June 2020 in the figure, predicts that the summer months will be dominated by the usual seasonal pattern, bringing the CO2 level down to a low for 2020 in September and October, which will be significantly higher than the 2019 low, though.
Posted 8 June 2022. Go to CO2 forecast page for more details and data.
Update of NAM documentation (NAM 20.2)
An updated version of the NAM documentation (dated 25 May 2020) is available here.
Posted 27 May 2020.
New all time high C02 level in April
Data published by ESRL Global Monitoring Division shows that April 2002 became the month with the new CO2 record . This record has been correctly forecasted in this post since August 2019, as Figure 1 shows.
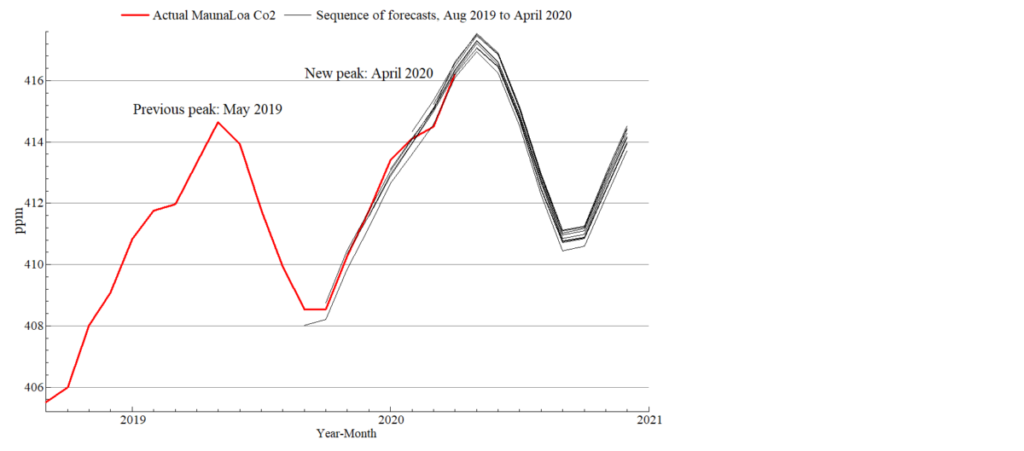
2019 as the first forecasted month and was conditional on August 2019 information. The newest has
May 2020 as the first forecast period (and is conditional on April 2020 information).
April’s world record may however soon be taken over by May 2020, as shown on CO2 forecast page.
Posted 8 May 2020
Covid-19 extraplations for 16-30 April, evaluations.
The numbers from the second half of April are now available, and the extrapolations for that period can be evaluated.
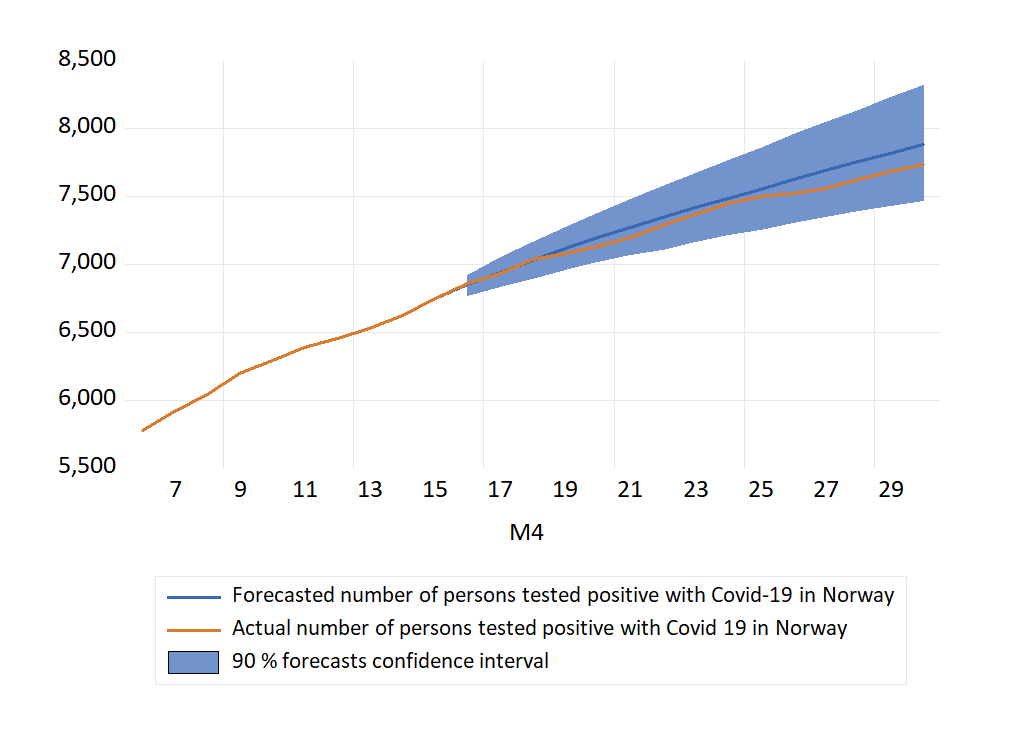
The graphs in the figure show that over the period as a whole, the extrapolated series overestimated the number of cases in Norway in April. Hence, the average forecast error (actual minus forecast) is negative. However, considering the forecast confidence intervals, there are no cases of forecast failure (the actual numbers are always inside the interval).
Although not strictly monotonous, there is a tendency of increasing overestimation as the length of the forecast horizon is increased (away from the origin of the forecast). By 21 April the error had grown to 73 persons. For the following days the errors became smaller (34 for 24 April for example). However, for the last days of April the errors increased again. For 30 April, the actual number of Covid-19 positives was 138 fewer than the forecasted number (made half a month earlier).
More evaluation of forecasted new cases and hospital patients: Covid 19 Norwegian unemployment and income page.
Posted 1 May 2020.
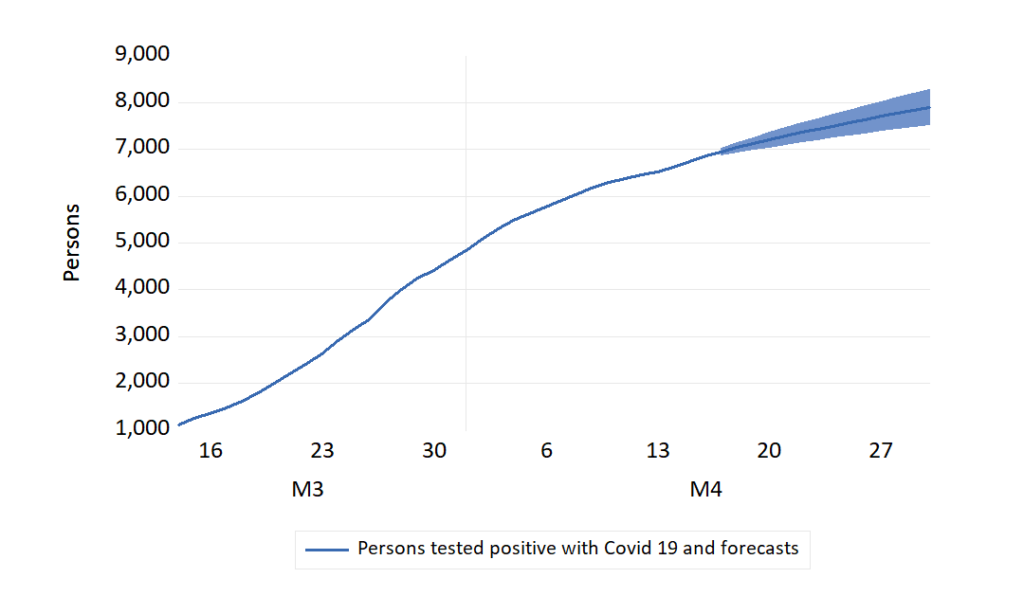
Covid19 in Norway, extrapolations
The curve showing the accumulated number of Covid19 cases in Norway has been relatively flat, partly due to lockdown measures. Over the next weeks, there will be a gradual opening-up, which makes it relevant to extrapolate how the numbers evolve.
Forecasts of accumulated Covid 19 cases (shown below), new positives and the number of patients in hosptials are posted on: Covid 19 Norwegian unemployment and income page.
Posted 16 April 2020.
CO2 forecast update: April 2020
Data published by ESRL Global Monitoring Division shows that the CO2 level measured in the athmosphere above Mauna Loa was 414.50 ppm in March 2020. This is lower than the 415.2 ppm forecasted in the previous posting (6 March 2020). The over-prediction is marginally significant, as the lower bound of the 95 % forecast interval for March was 414.55 ppm.
The new forecast nevertheless indicates that the secular rise in the CO2 level in the athmosphere is continuing, and that April 2020 is likely to become the month with highest recorded level of CO2 in history, cf. the figure below.
The CO2 forecast page contains more details and earlier forecasts.
Posted on 7 March 2020
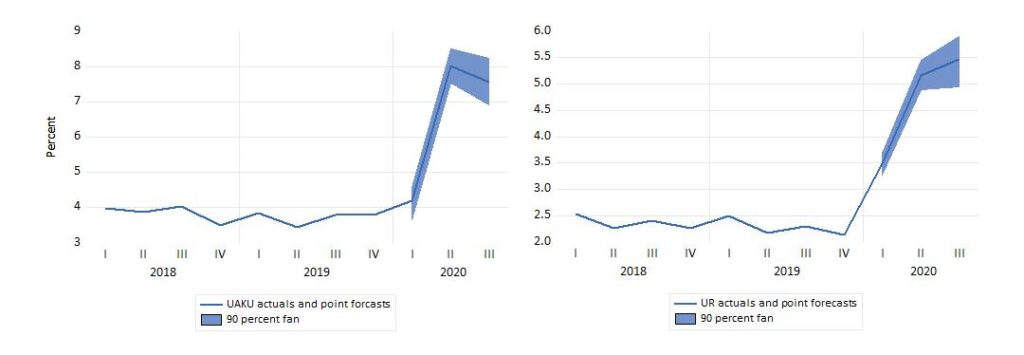
Unemployment during the ongoing Covid 19 crisis, and after
In the second week after the “lock-down” of the Norwegian economy as part of the fight against Covid 19, the rate of registered unemployment continued to increase dramatically to approximately ten percent of the workforce. The phenomenon of collective lay-offs is the all-dominating cause of the increase in registered unemployment.
If the laid-off wage earners return to their jobs over the next weeks and months, the unemployment level can start finding back towards the level from earlier this year. However, as a huge Covid 19 caused international downturn now seems unavoidable, such a scenario does not seem to be likely.
Both the registered unemployment rate (UR) and the labour force survey measure (UAKU), are endogenous variables in Norwegian Aggregate Model (NAM). The figur shows forecasts for the two measures of the unemployment rate for the three first quarters of 2020, conditional on the lay-offs seen in March, as well as on some of the other dimensions of the crisis, i.e., contraction of private domestic demand, plummeting international trade, but also monetary policy stimulus.
More about this on the Covid 19 Norwegian unemployment and income page.
International economic crisis as well as measures taken to fight-off Covid 19 takes its toll on Norwegian jobs
The number of lay-offs per day is increasing in a way hitherto unseen in Norway. New statistics from NAV imply that the number of workers who applied for unemployment benefits on Tuesday 17 March amounted to more than 2 percent of the workforce. The total number of new UB applicants was 63680. Most of these (59930) were collective temporary lay-offs, see graph.
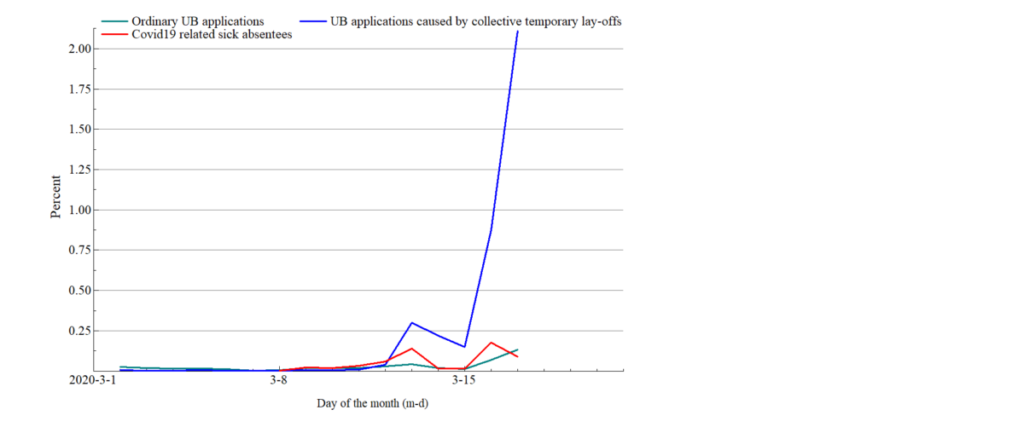
(green line) and new sick absentees due to Covid 19 virus. In percent of labour force (fourth quarter 2019)
Source: NAV and Statistics Norway
Though temporary, most of the new daily UB applications are certain to enter the stock of unemployed workers, which is therefore believed to increase swiftly to very high levels by Norwegian standards.
On the same day, 17 March, the number of new workers being away from work due to Covid 19 (suspected as well as diagnosed after testing) was 0.09 percent of the workforce. Increasing from previous days though.
CO2 forecast update: March 2020
The longest time series for atmospheric CO2 is for the Pacific island of Mauna Loa. Based on this time series, the development of the CO2 level can be forecasted on a monthly basis.
The updated forecast supports our earlier forecasts saying that the CO2 level may reach a new all-time high already in March 2020, and that the level is likely to increase to more than 417 ppm in May 2020, significantly higher than the highest level recorded so far, which was for May 2019 (cf. the figure below.)
See the CO2 forecast page for more details. Posted on 6 March 2020
A plague of interest rate setters
At the end of 2019, the rate of CPIAET inflation in Norway was right on the 2 percent inflation target (see graph). However, forecasts that take into account that the effect of the weakening of the international value of the krone may indicate that inflation will be moving up and away from the target. The graph in the upper panel of the figure shows one such forecast.
In the course of the winter, signals have also been strengthened about a weakening performance of the Norwegian real economy. For example, forecasts have shown, for some time already that an increase in the rate of unemployment in 2020 is plausible.
In such circumstances, Norges Bank’s projected interest rate for the future reflects the balancing of partly conflicting policy goals. The second graph in the figure shows the interest rate path from the last monetary policy report in 2019, as replicated by simulation of Norwegian Aggregate Model (NAM). Given the likelihood of higher inflation, an inflation targeting central bank might be expected to signal a higher interest rate level in the future. However, Norges Banks is not particularly inflation targeting in practice. Especially with the negative economic consequences of the new coronavirus now above the short-run policy horizon, the interest rate is more likely to be lowered, in Norway as elsewhere.
At the same time, the mechanisms behind the possible disruptive effects of coronavirus disease are in many respects different from the scenarios where interest rate reductions are believed to be effective. Reduced man-hours in production due to illness and quarantine, and resulting reduced trade with intermediary goods, are consequences that are not fixed by lowering the interest rate. Parts of aggregate demand, in particular tourisms and travel, entertainment and education, seem to be acutely impacted by virus fright, but also by health policy measures needed take down the risk of pandemic developments. Interest rate cuts will do little to raise aggregate demand as long as such factors are dominating the picture. (4 March 2022)
Norwegian Aggregate Model version 20.1
A new version of the NAM documentation is available here. It documents new model features and revisions of existing ones.
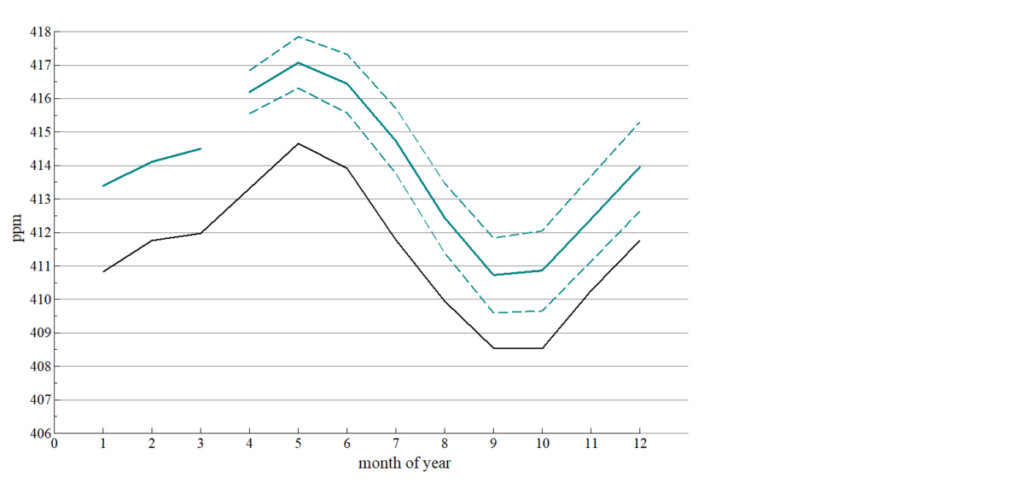
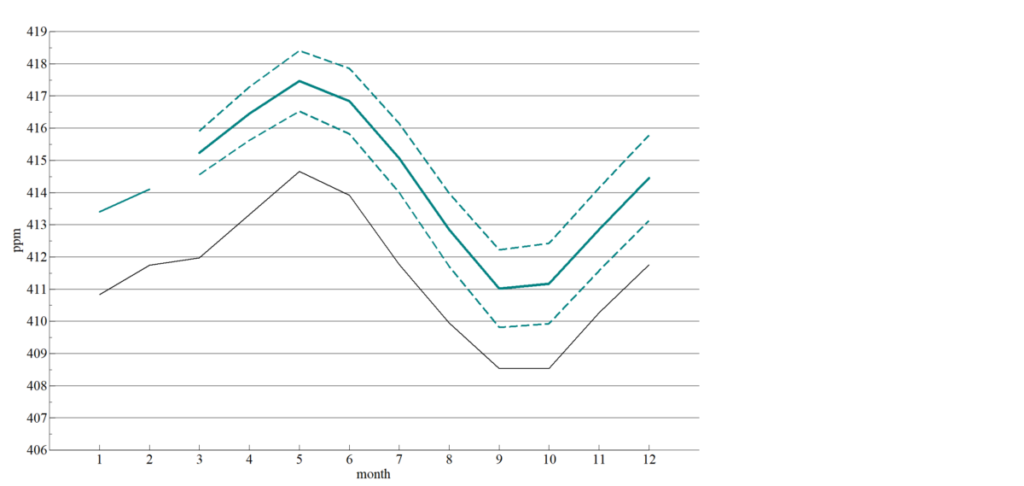
CO2 forecast update: February 2020
The longest time series for atmospheric CO2 is for the Pacific island of Mauna Loa. Based on this time series, the development of the CO2 level can be forecasted on a monthly basis.
The atmospheric level of CO2 measured in January 2020 was 413.4 pp (average for the month). The latest forecast for January was 413.12 ppm. The updated forecast predicts that the CO2 level may reach a new all-time high in March 2020, and that the level might increase to 417.548 ppm in May 2020, which is significantly higher than the highest level recorded so far, which was for May 2019.
These predictions are illustrated in the figure below, which shows the forecasts for 2020(2)-2020(12) in the same figure as the actuals for 2019(1)-2020(1) (the dotted line). The vertical distance between the dashed lines indicate 95 percent forecast intervals.
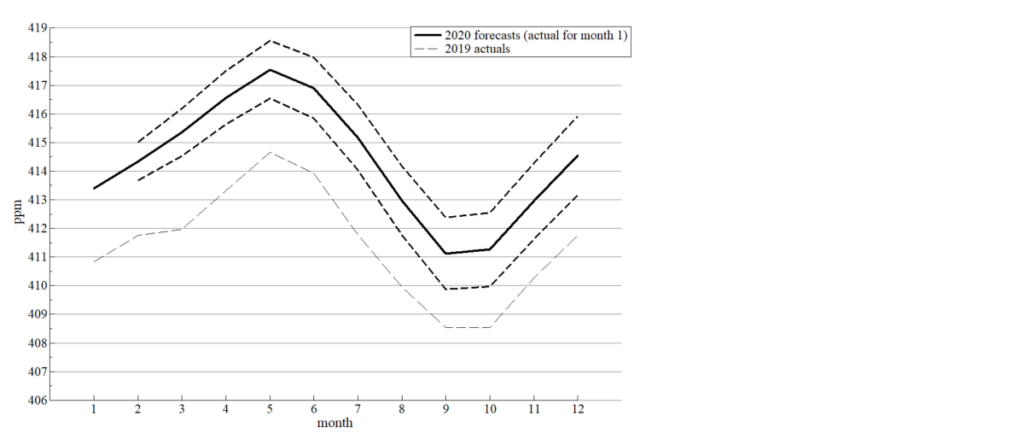
or 2019 (thin dashed line).
See the CO2 forecast page for more details.
Posted on 7 February 2020
——-
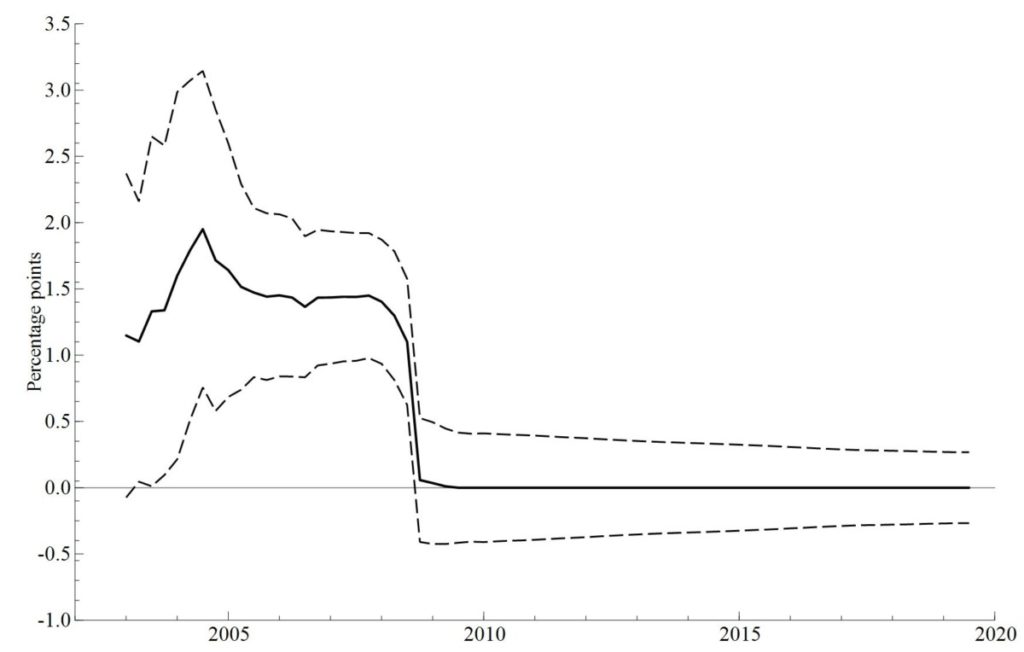
The day inflation targeting died
Norway’s monetary policy regime formally changed to inflation targeting in March 2001. In the following years, Norges Banks’s practicing of the new policy regime impacted significantly on the interest rate level. However, soon after the coming of the international financial crisis, the footprints of inflation targeting became more difficult to follow in the data, and they soon disappeared altogether.
The figure below tracks this development by showing an estimated “Taylor-coefficient” which measures by how much the policy interest rate can be expected to increase when the inflation gap changes by one unit.
In the heyday of inflation targeting, an increase in the inflation gap could be expected to lead to an even larger increase in the policy rate. However, soon after the financial crisis the estimated Taylor coefficient plunged down to zero. On the face of it, the epoch of inflation targeting was over almost as soon as the regime had installed itself.
Norges Bank cut policy interest rate three times in the autumn of 2009. However, on exact which day, 15 October, 20 October or 17 December, inflation targeting became defunct may better be left is for the monetary policy historians to find out.
Posted 8 January 2020. pdf-version